Data Analytics Case Study
Property Survey
The Outlet Collection | Seattle

Background: During my tenure as Marketing Director at The Outlet Collection Seattle, I worked under Washington Prime Group, the corporate owner of the retail property. In this role, I was responsible for providing quarterly feedback on tenant performance across several key areas, including traffic trends, marketing participation, and sales performance.
Concern: When compiling these reports, much of the information was anecdotal—such as customer-preferred retailers. Sales data was inconsistently provided, making it an unreliable metric for performance evaluation.
“It is a capital mistake to theorize before one has data.”
-Sherlock Holmes in “A Study in Scarlet” by Arthur Conan Doyle
The Pivot: After reflecting on the low response rate, I hypothesized that entryway posters were too easy to overlook and too inconvenient for shoppers to engage with. In contrast, the food court offered a captive audience—people naturally sit, eat, and scroll on their phones. I leveraged this by designing a table-top tent: one side promoted the survey, while the other advertised the effectiveness of table-top tents for brand exposure, creating a new sponsorship sales opportunity for our leasing team.
The Result: This new strategy proved highly effective—we received over 1,000 responses within three months. The influx of data allowed us to deliver comprehensive, data-driven insights in our next quarterly report to corporate, significantly improving the quality and credibility of our tenant performance feedback.

Formulating The Survey: Our survey underwent several rounds of revisions to ensure questions were unbiased, easy to answer—improving completion rates—and aligned with corporate data needs.
Implementing the Survey: Initially, I placed posters at all mall entry points featuring a QR code linking to the survey, along with a prominent headline promoting a monetary raffle as an incentive. However, this approach yielded only about 15 responses over two weeks. Realizing the response rate was lower than anticipated, I quickly pivoted strategies.
Data Analysis
The Outlet Collection | Seattle

The Data: Rather than presenting customers with a list of over 100 tenants, which could introduce bias by giving top-listed retailers greater visibility and influencing recall, we opted for a free-form text field. This allowed customers to organically list the retailers they intentionally visited, resulting in more authentic, unprompted feedback.
Data Cleaning: Freeform text responses were exported to Excel with all tenant names listed in a single cell, making it challenging to analyze the data using pivot tables. To resolve this, I used the Text to Columns function to separate each word into its own column, allowing each tenant mention to be counted as an individual data point. While this method wasn’t perfect and required some manual cleanup (e.g., correcting misspellings and consolidating two-word tenant names), it allowed for me to utilize the pivot table function.
Example Of Before:
Example Of After:

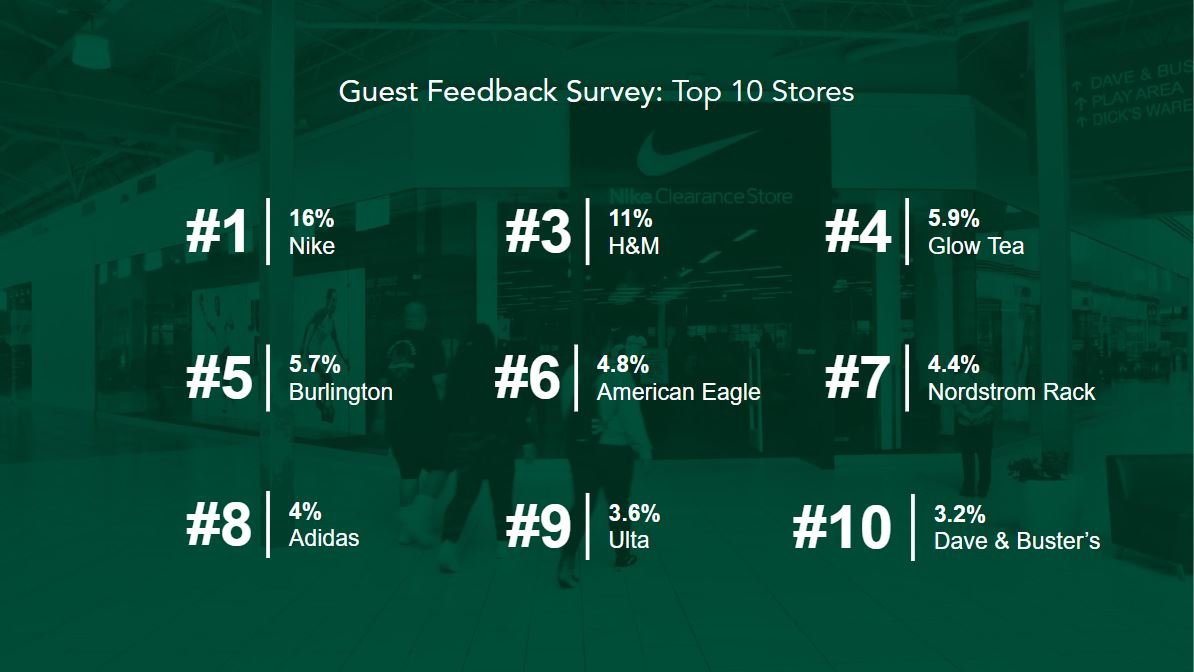
The Result: Our presentation to corporate was grounded in real, customer-provided data. The PowerPoint slide shown was particularly well-received—though it’s worth noting the absence of a #2 ranking. That’s because the second most common response was no tenant at all. Many customers reported visiting the mall without a specific retailer in mind, simply seeking the overall shopping experience. This insight impressed our corporate partners and sparked conversations about implementing a similar survey across other top-performing properties in the portfolio.