Hubspot CRM
Workflows
Operating as the CRM expert for Landmark Event Co. I was often tasked with maintaining, updating and creating many workflows. This included creating new properties to use as triggers or using lists and a workaround.
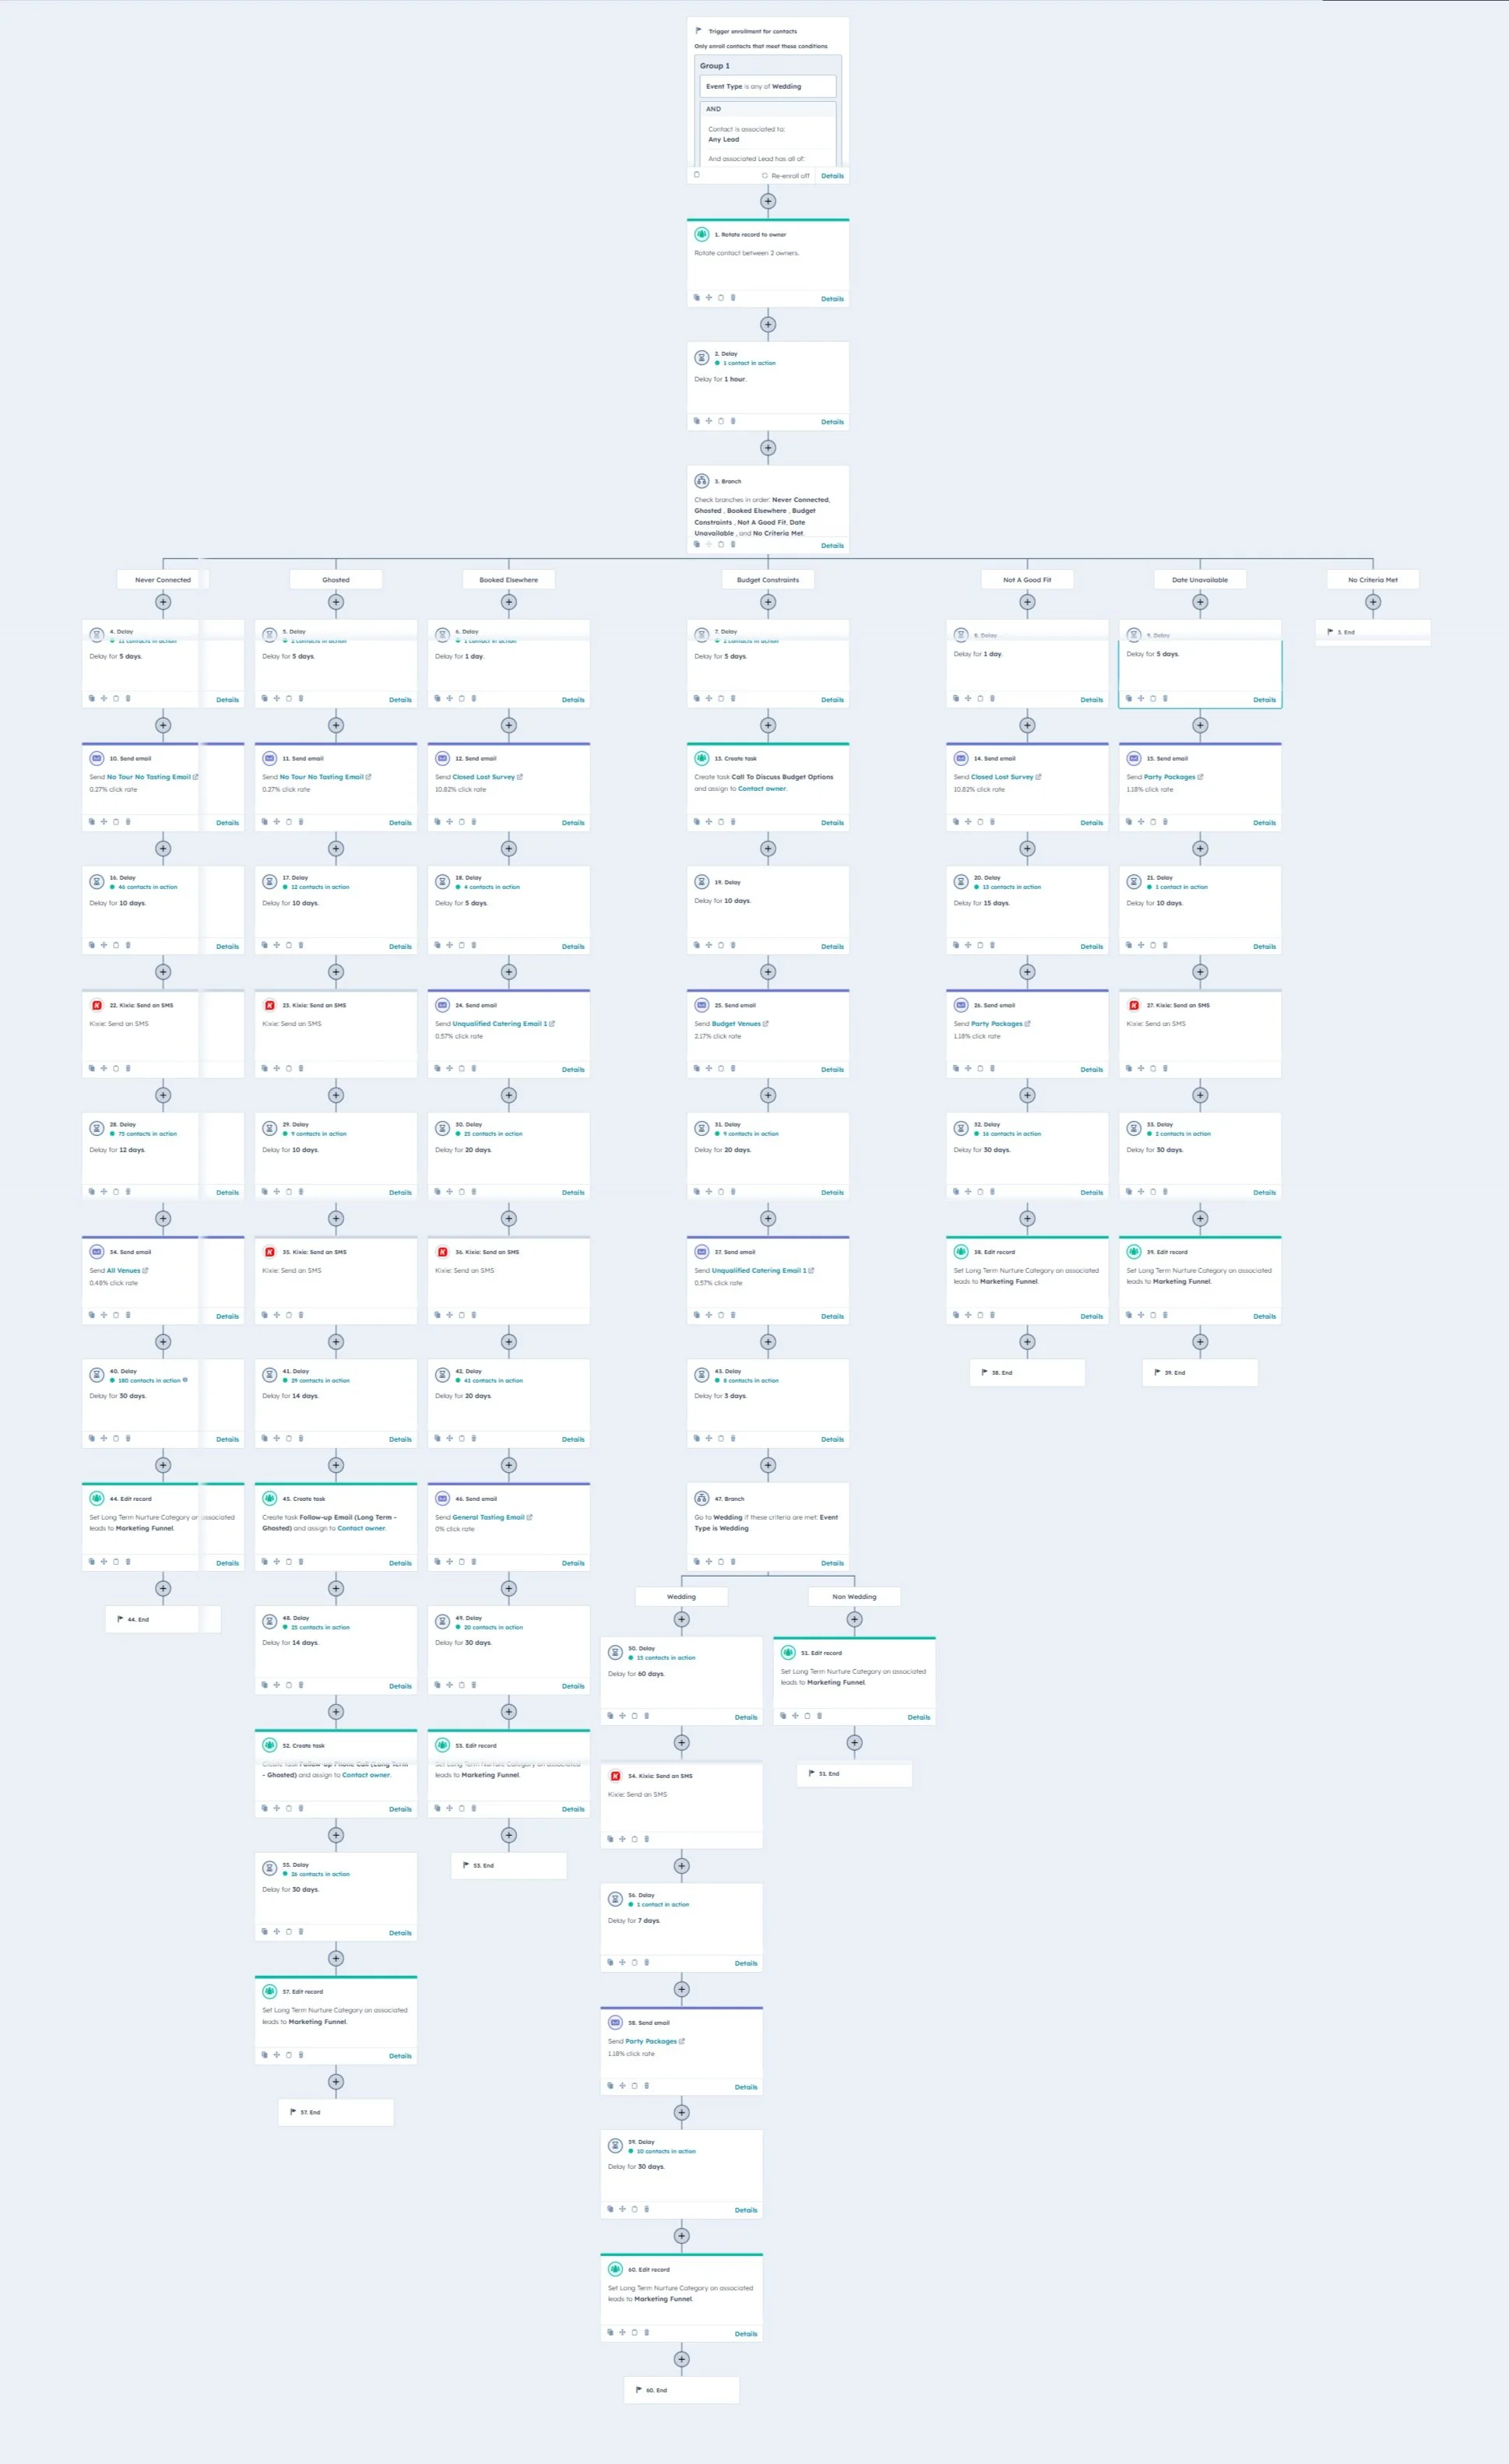
One of my most in-depth workflows is the pictures Long-Term Nurture workflow. Upon utilizing the lead pipeline in Hubspot, we were presented with a challenge. Some leads became qualified, a few became disqualified, but many would sit in a limbo of connected. This was due to a lead needing to request a proposal to become qualified.
This led to the creation of the long-term nurture category, something I added in the lead pipeline settings as a 3rd completion stage.
The long-term nurture category had several “buckets” within it that our concierge would sort a lead into based on the reason they did not move forward. This bucket would then trigger a specific marketing workflow complete with automated email and SMS.
Dashboards
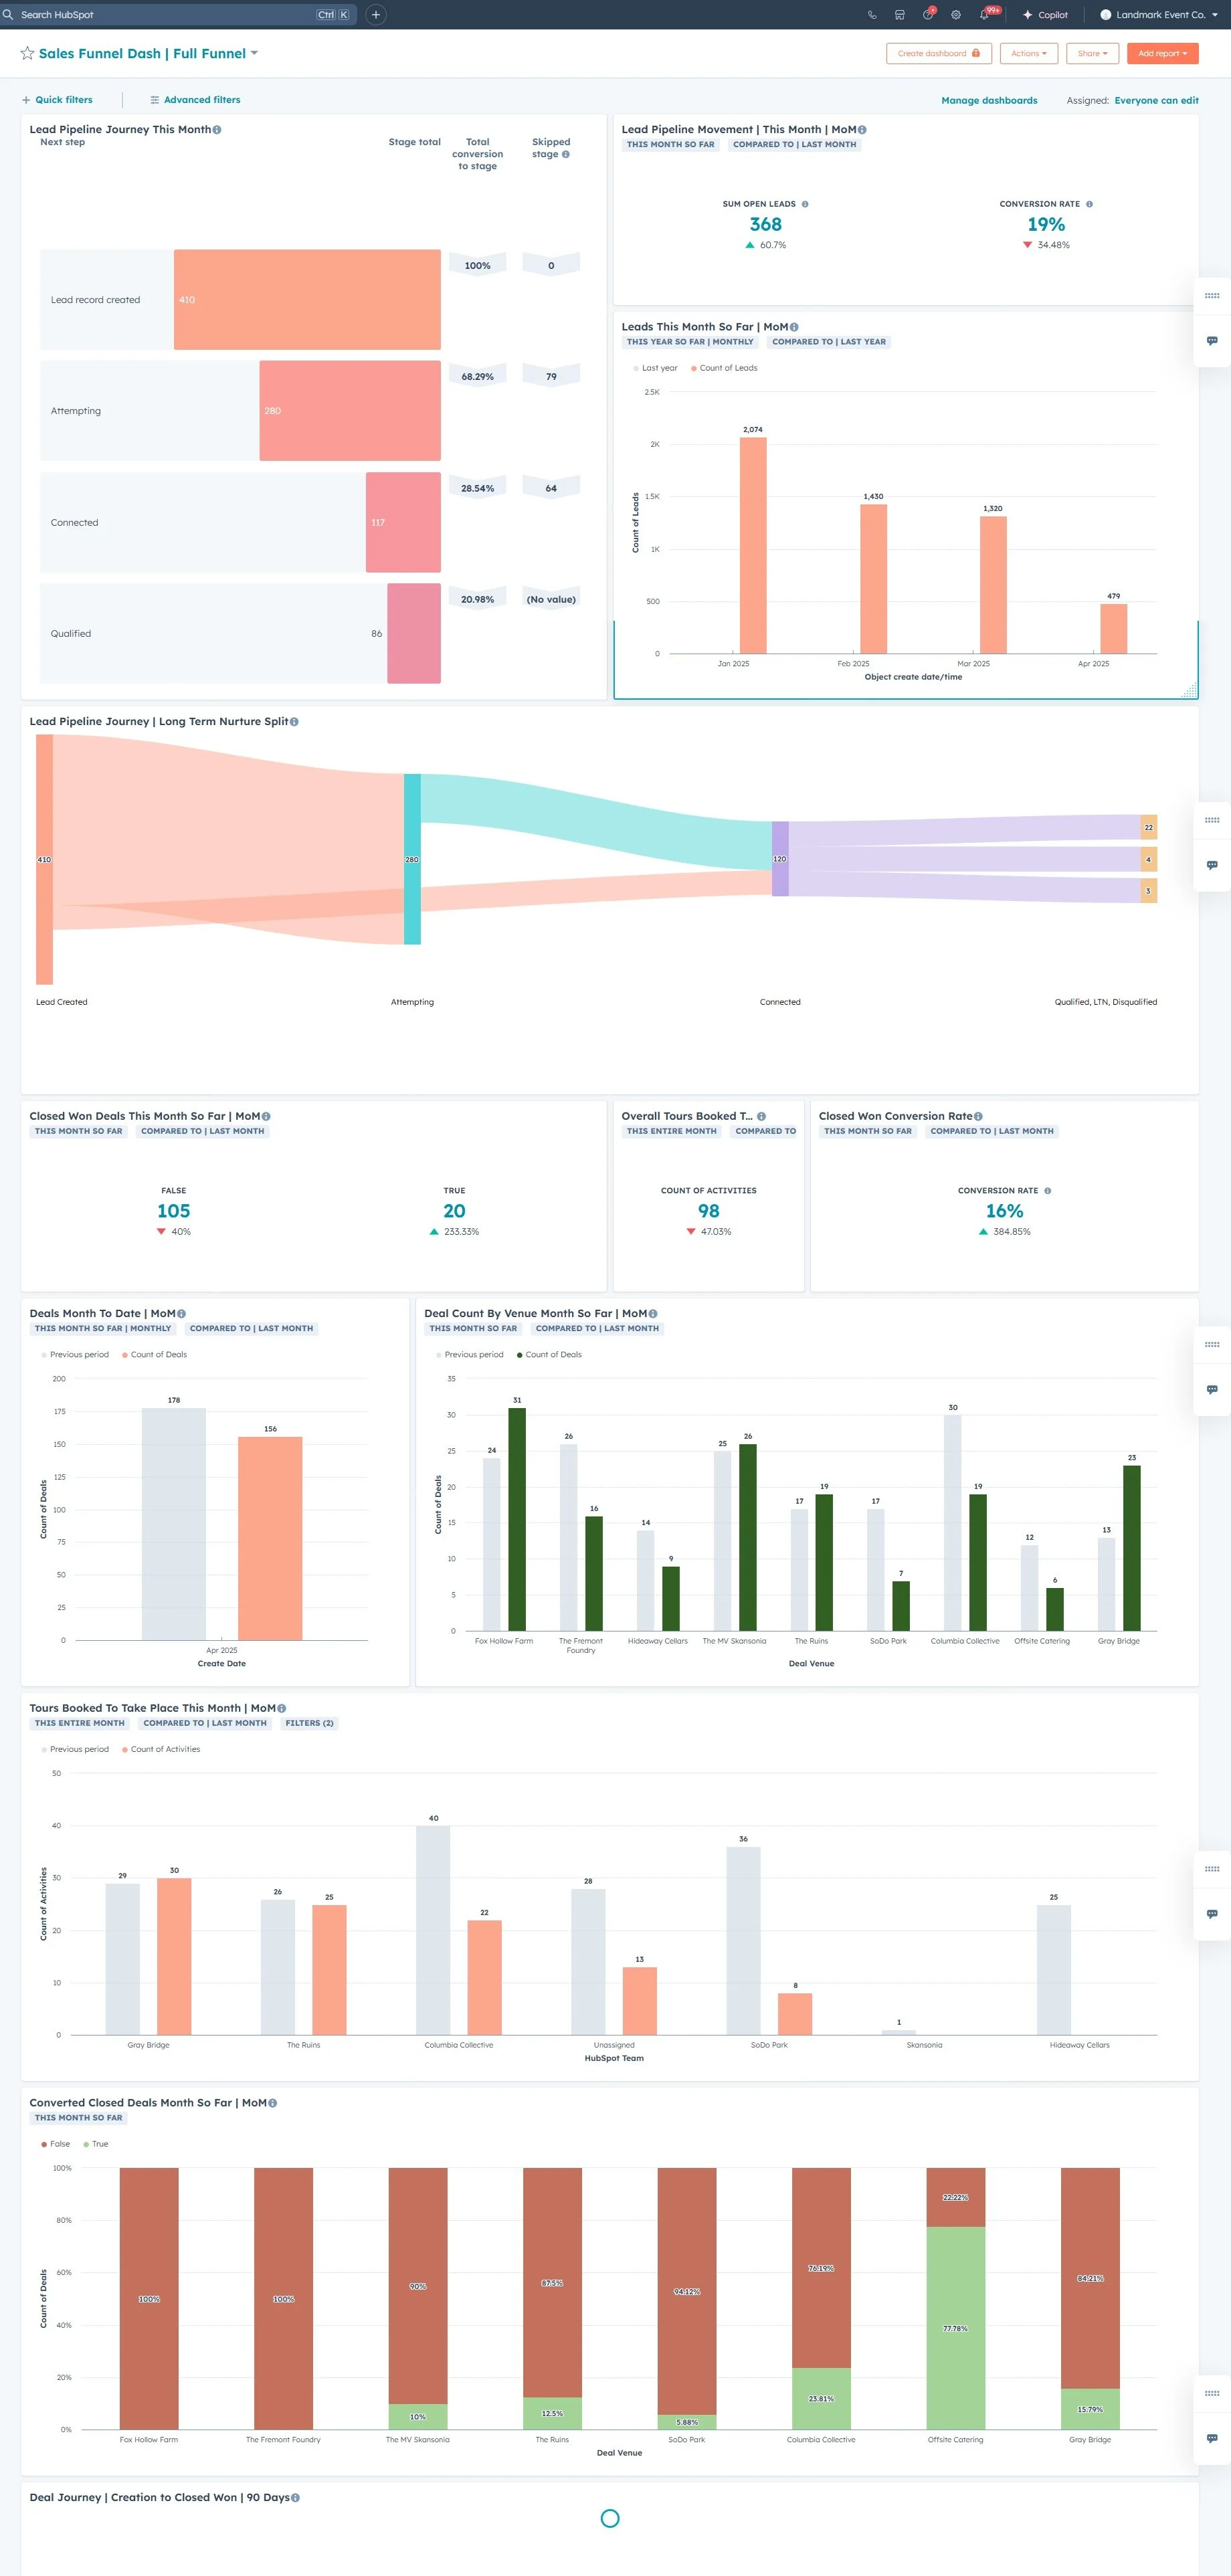
Though I maintained a weekly and monthly KPI Excel sheet, leadership needed up-to-date data on venues and sales data. I developed 22 new dashboards, 10 covering each individual venue, 6 covering in-depth sections of the sales pipeline, and then individual dashboards covering Venue Managers’ performance, General Marketing, campaign tracking, concierge lead interaction and then website traffic journeys.
These dashboards covers metrics like:
MoM and WoW tour bookings
MoM and WoW closed deals
Task completion rate by Venue Manager
Email sends by venue team
Open deals to closed deals ratio
Closed lost to closed won deal ratio
Toured to closed won rate
Revenue booked